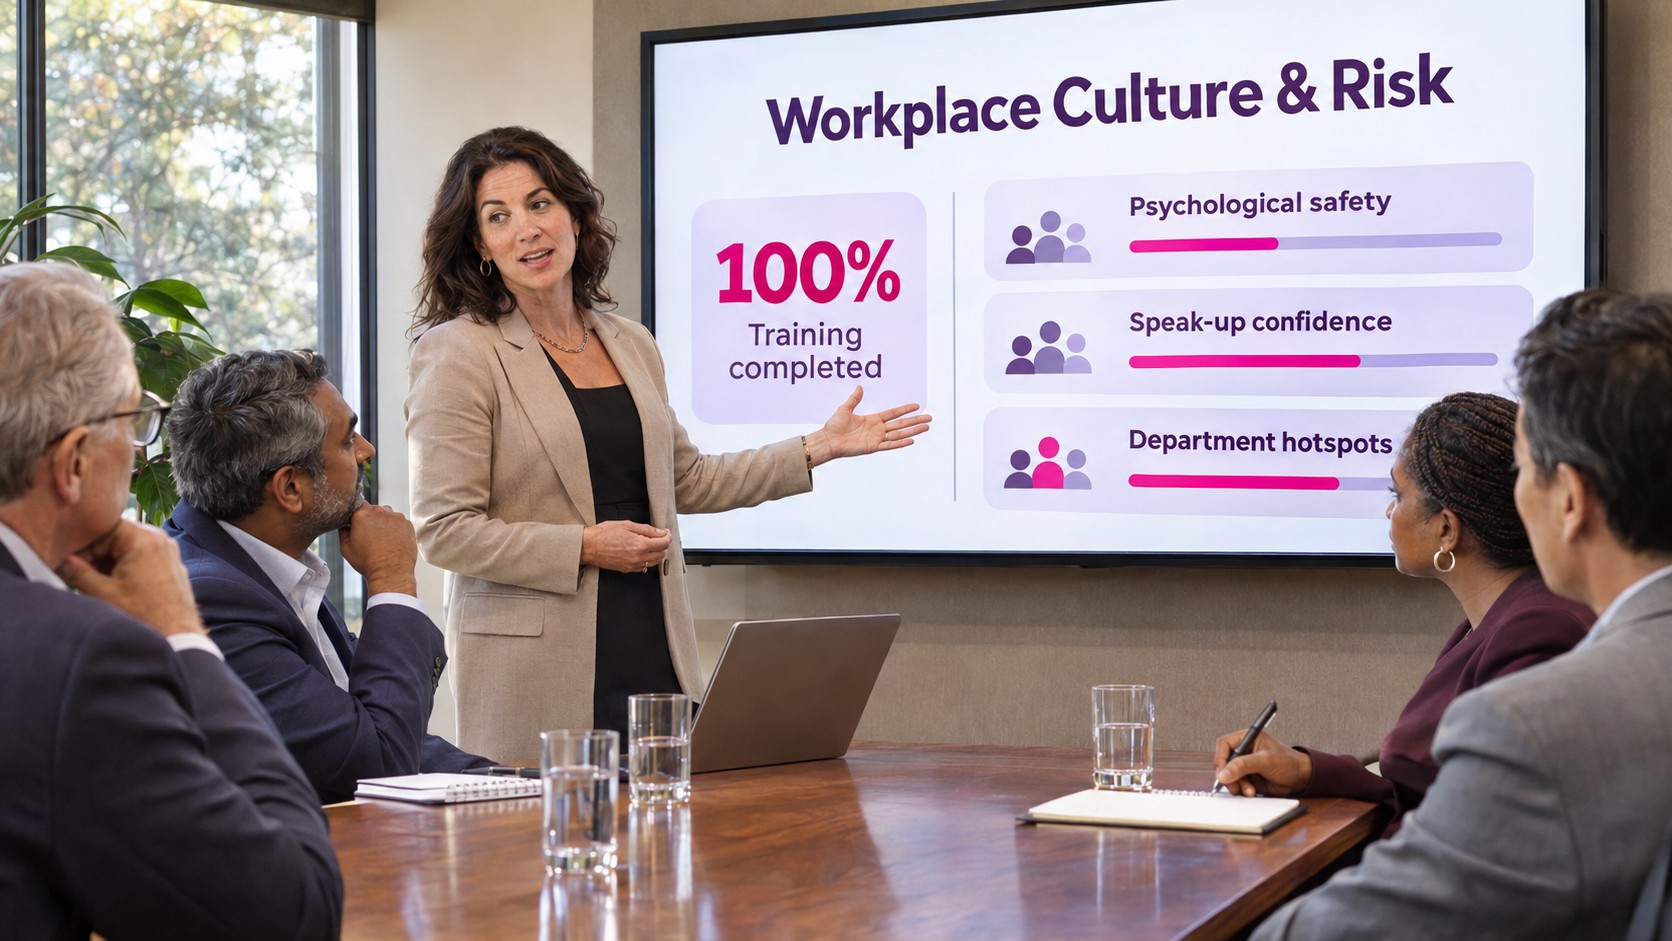
For decades, Learning & Development (L&D) leaders have walked into executive meetings armed with the same chart: a green bar showing 98% or 100% compliance training completion.
And for decades, executives have asked the same quiet follow-up question: “So what?”
Completion rates prove that employees clicked “next” until they reached the final slide. They do not tell you if managers are actually equipped to handle conflict, whether teams feel safe speaking up, or which department is quietly brewing your next major HR claim or turnover spike.
In short, completion rates are a vanity metric. When L&D relies solely on seat time and quiz scores, training remains a “check-the-box” cost center—and your organization remains exposed to preventable cultural and legal risks.
To earn a strategic seat at the executive table, L&D leaders need to shift from measuring content consumption to measuring behavioral risk. Here is how modern learning teams are making that leap.
The Blind Spot of Traditional LMS Metrics
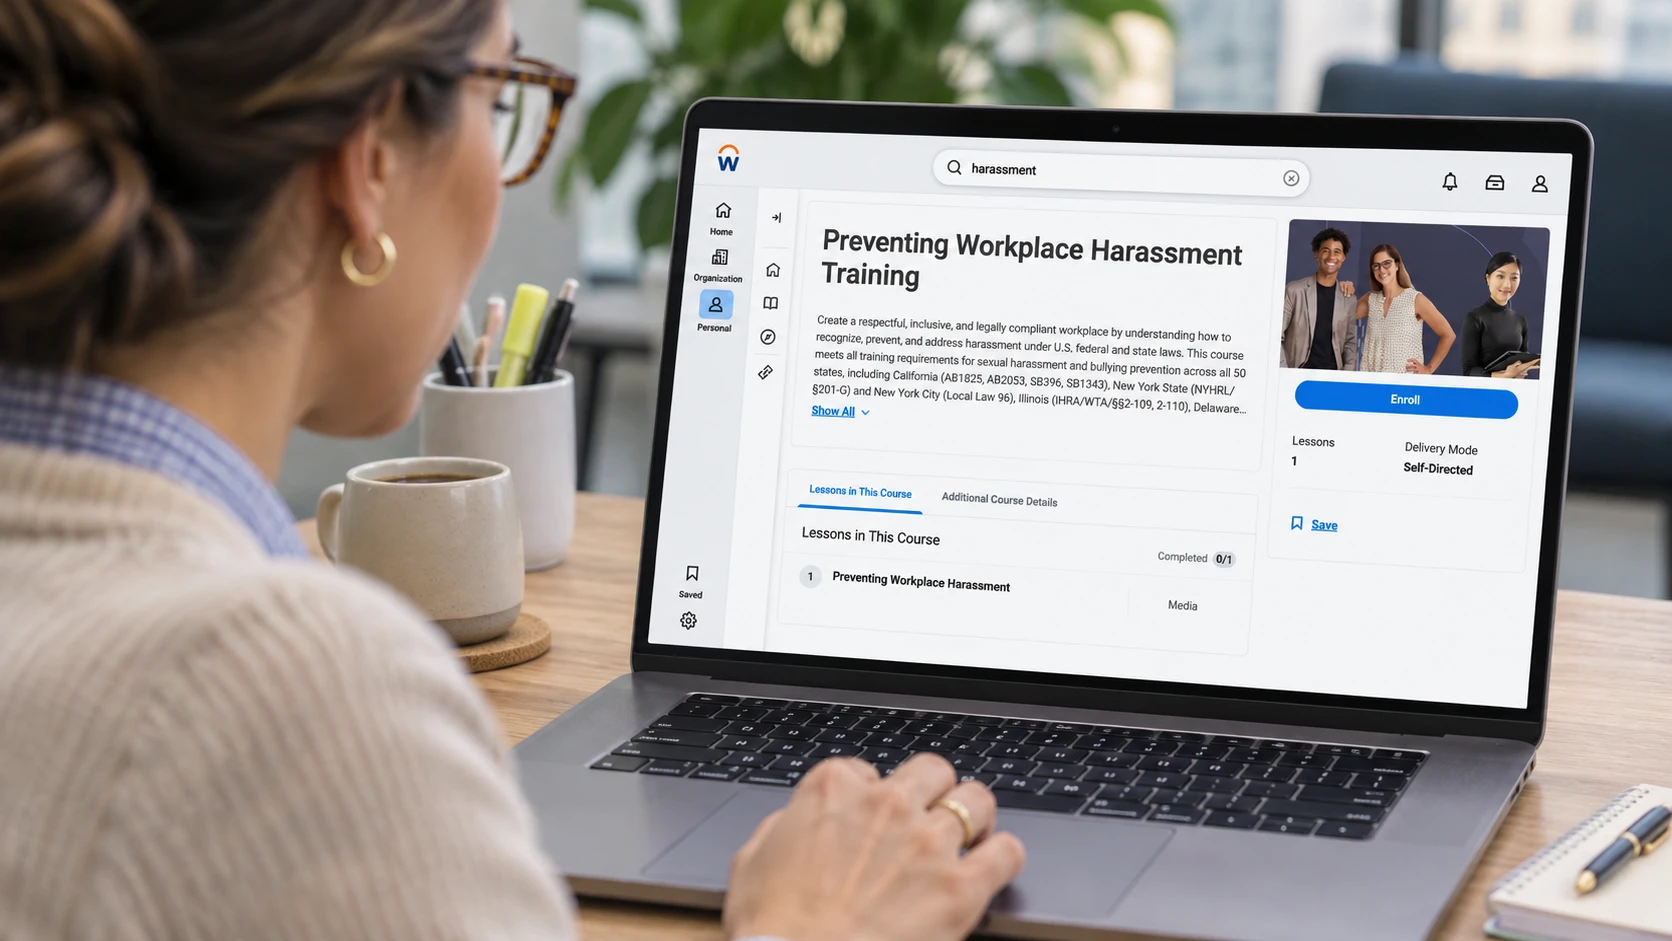
Standard Learning Management Systems (LMS) were built for logistics, not diagnostics. They track:
- Who started a module
- How long it took them to finish
- Whether they passed a multiple-choice policy quiz
The problem? People know how to pass a multiple-choice test. Knowing the company policy on retaliation or harassment is completely different from believing your manager will actually back you up when you report an issue. When you only measure policy recall, you miss the gap between what your handbook says and how your culture actually operates.
What to Measure Instead: 4 Leading Indicators of Risk
When you build situational judgment questions and sentiment pulse checks directly into your courses, every training rollout becomes a diagnostic tool. Instead of waiting for an annual engagement survey—or worse, an exit interview or legal claim—L&D can track four high-impact metrics:
1. Decision-Making Under Pressure
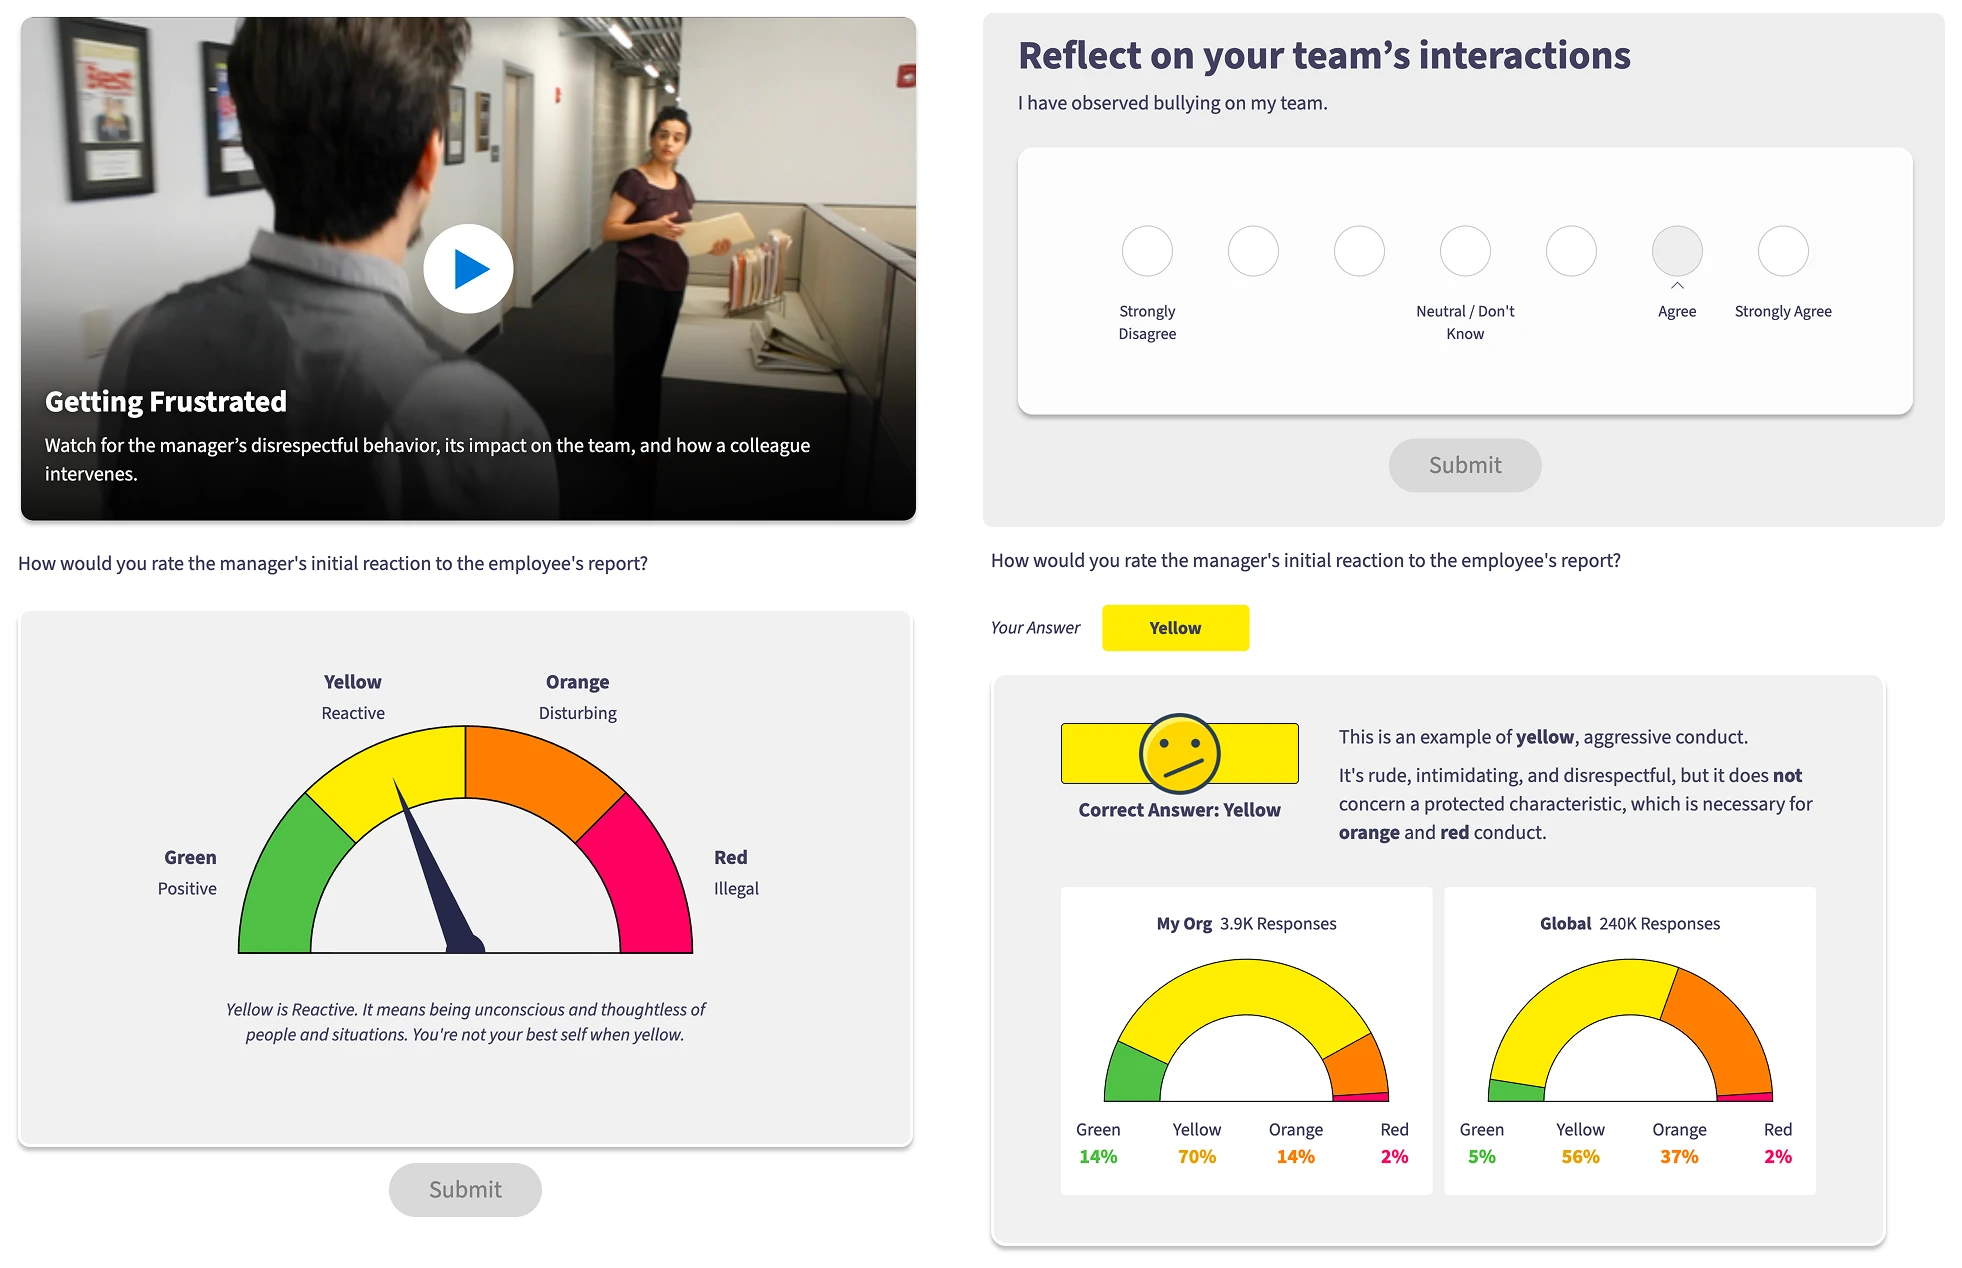
Rather than asking “What is our policy on X?”, scenario-based training puts learners in realistic workplace gray areas and asks, “What would you do here?” Tracking where employees hesitate or choose risky shortcuts reveals exact skill gaps before they turn into compliance failures.
2. Psychological Safety & Trust Signals
Do employees feel safe speaking up without fear of retaliation? By embedding anonymous sentiment checks inside relevant video scenarios, you capture honest data while the learner is already engaged in the context of the issue—eliminating survey fatigue and boosting candor.
3. Department-Level Hotspots
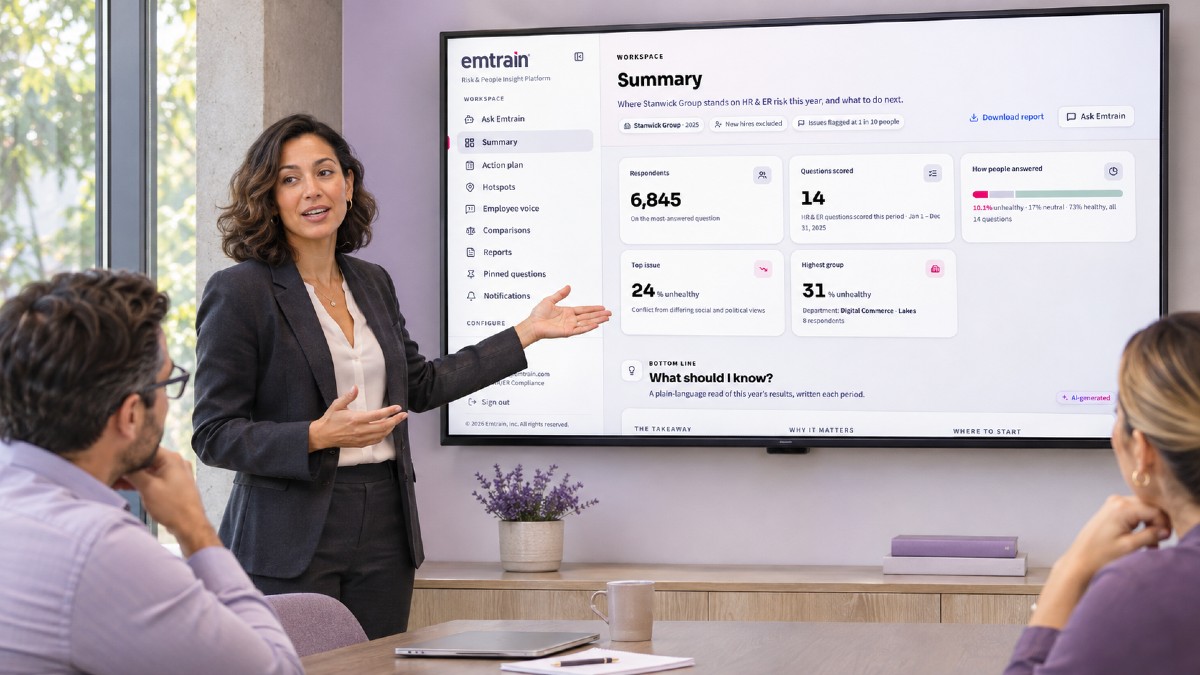
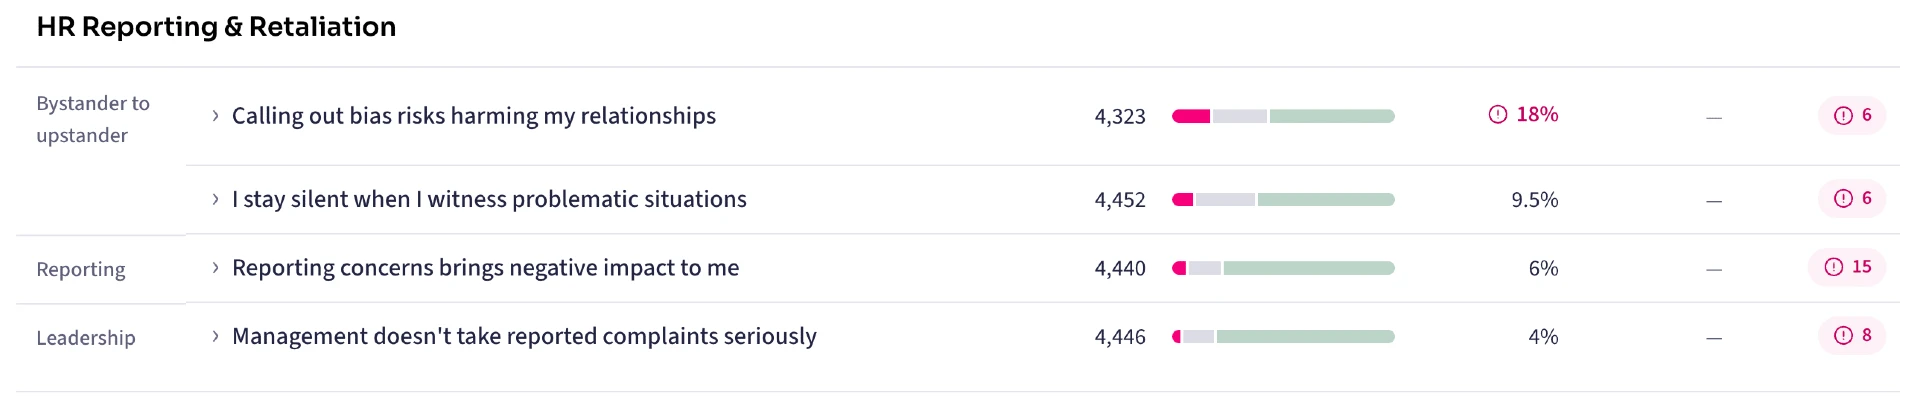
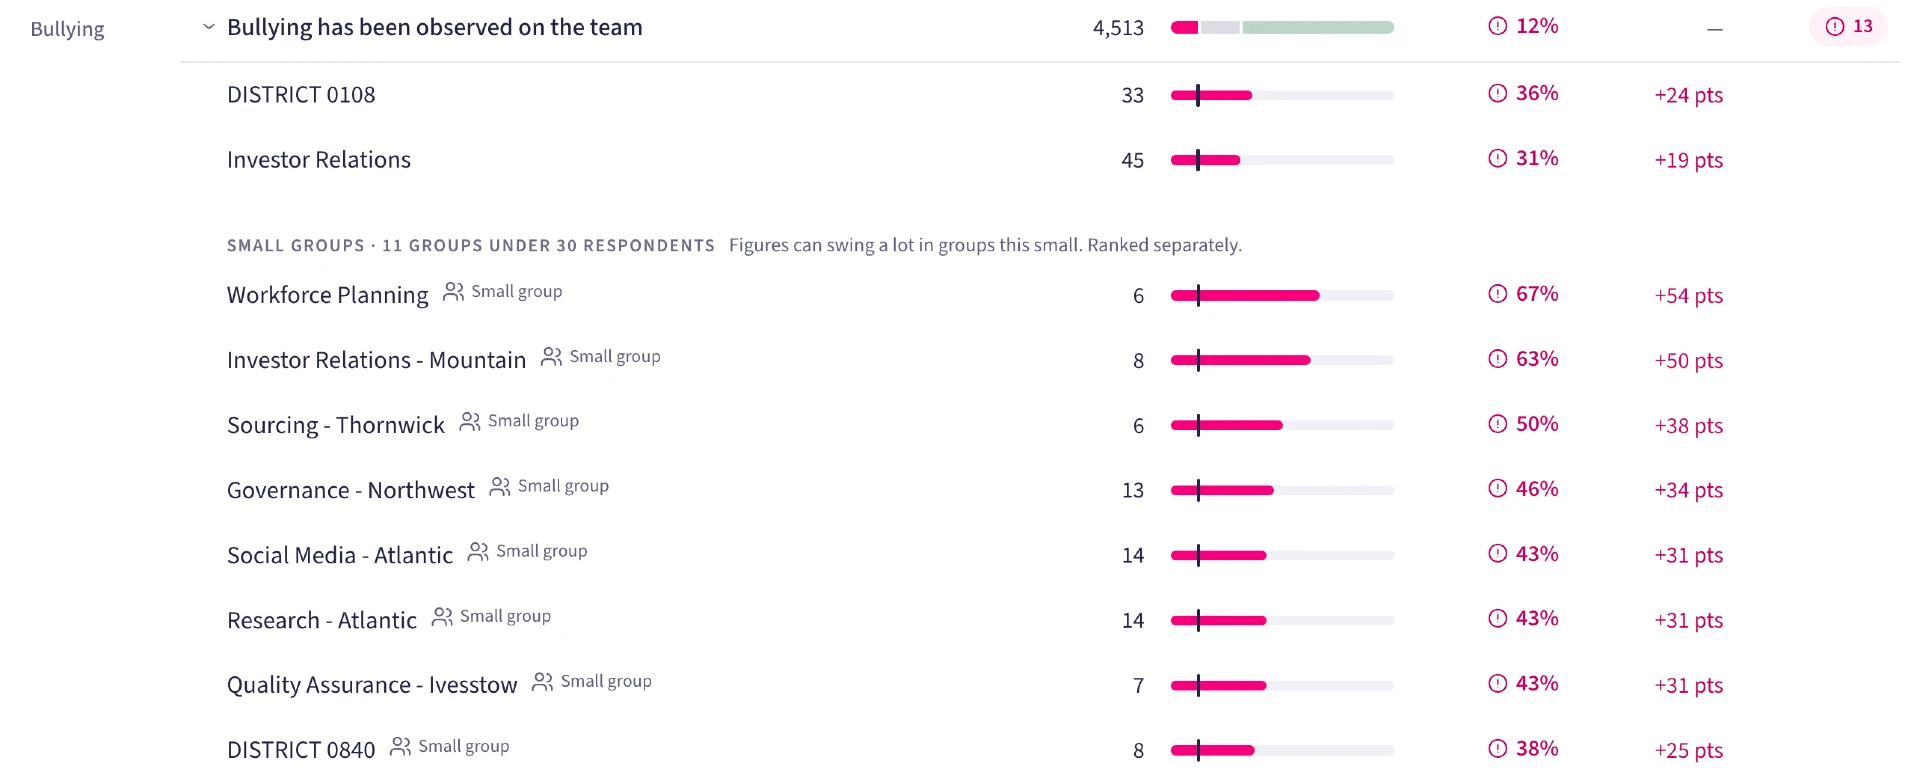
Company-wide averages hide localized problems. An organization can score well overall while a single high-growth department or regional office struggles with bullying, manager burnout, or inconsistent policy enforcement. Segmenting learning analytics by department or location lets you pinpoint where risk is concentrated compared to the rest of the org.
4. External Peer Benchmarks
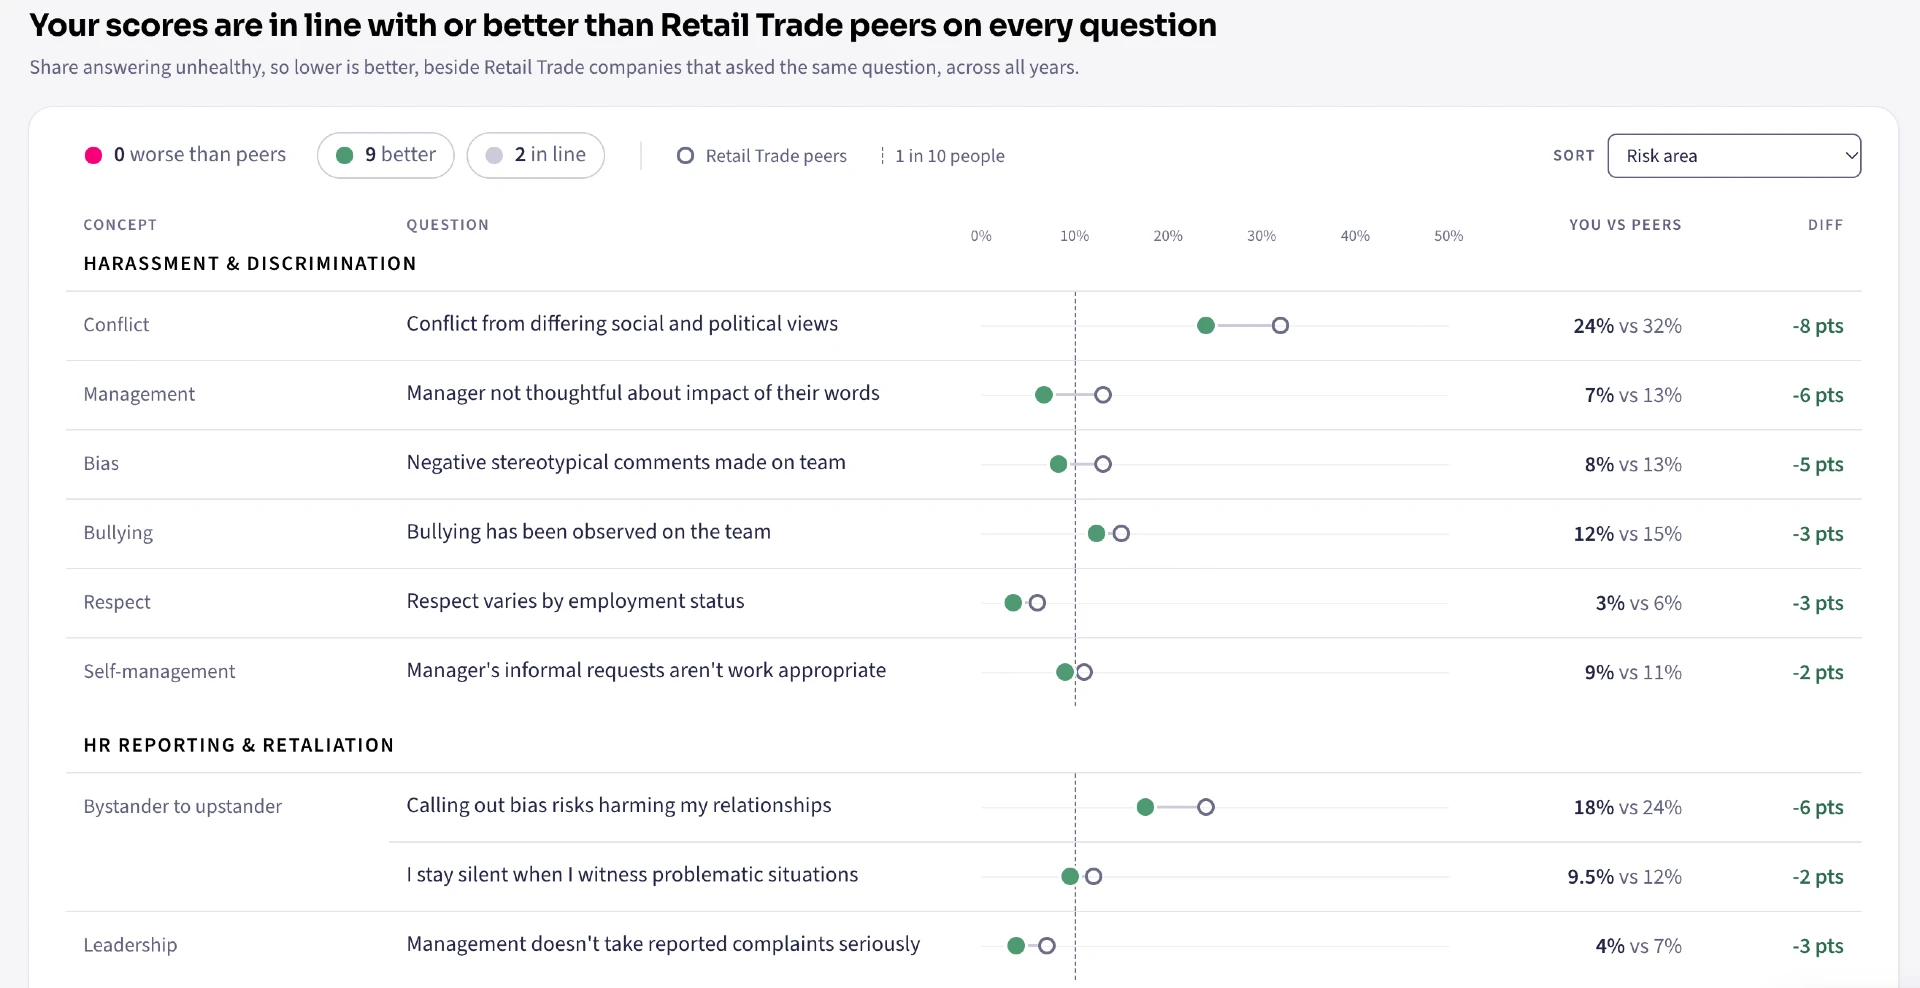
Is a 15% hesitation rate on a conflict-resolution scenario normal, or is it a red flag? Comparing your internal learner responses against anonymized industry benchmarks gives executives objective context on how your workplace culture stacks up against peers.
Turning Diagnostics Into Action
Data is only valuable if L&D can act on it quickly. Historically, spotting a cultural trend meant spending months scoping, scripting, and building a new training intervention—by which time the moment had passed.
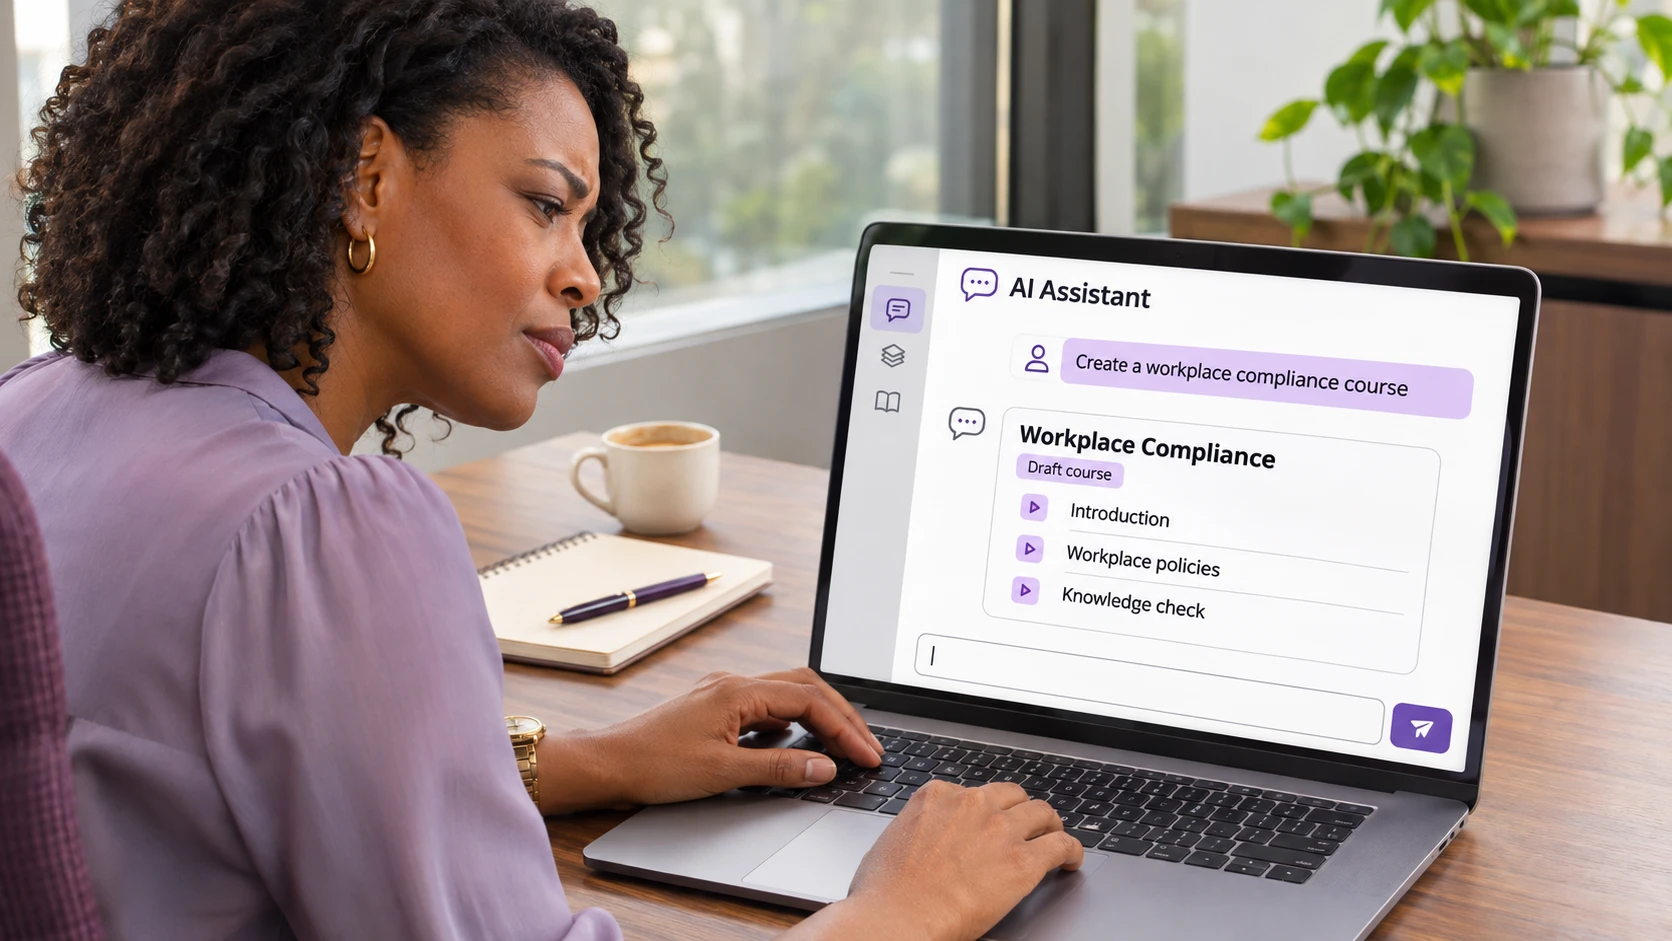
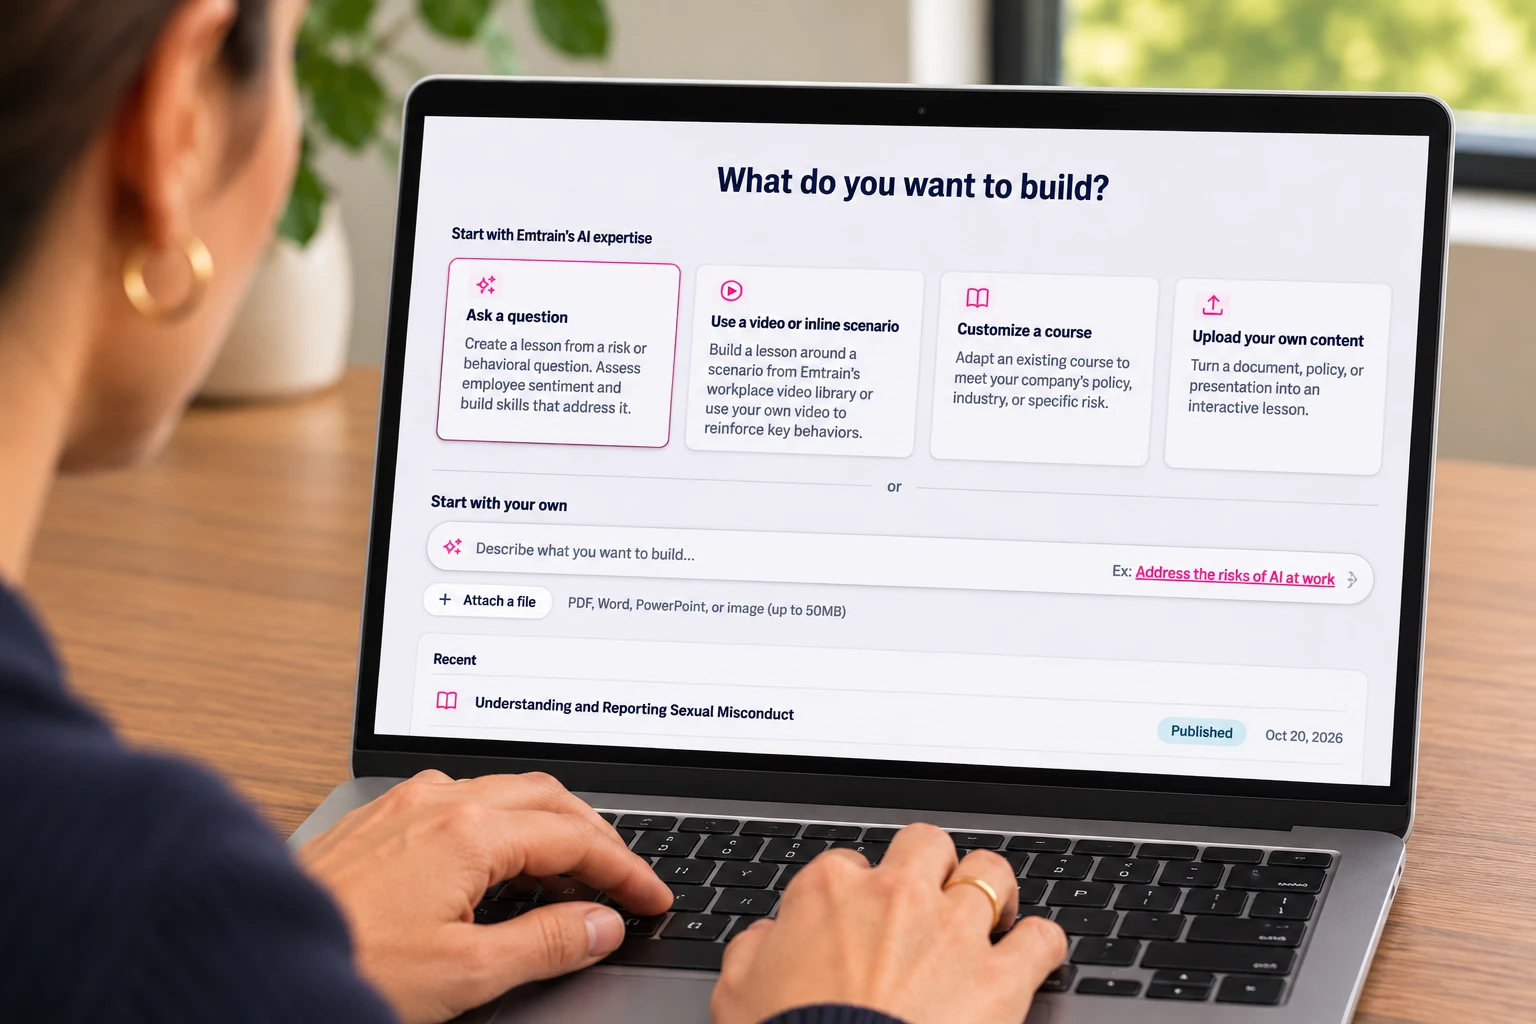
With an AI-powered course authoring tool paired with built-in risk analytics, that loop closes in hours, not quarters:
- Spot the signal: Your analytics dashboard flags a dip in manager accountability or a spike in bystander hesitation within a specific business unit.
- Pinpoint the behavior: You review the exact scenario questions driving the trend to understand why employees are stuck.
- Deploy targeted microlearning: Using an authoring tool grounded in compliance and workplace expertise, you generate a custom, role-specific follow-up lesson—such as building manager skills to set expectations—and deliver it directly to the teams that need it most.
The Bottom Line for L&D Leaders
When your authoring tool doubles as a risk-analytics engine, the conversation with the C-suite changes completely. You stop reporting on how many hours employees spent in training, and start showing executives where organizational risk is dropping, how manager capability is improving, and how L&D is actively protecting the business.
Ready to see what your training data is missing? Explore how AI course authoring and built-in workplace risk analytics work together.