Download our Culture Report Spotlight on The State of Workplace Harassment
Emtrain Intelligence Risk Area
Workplace Safety
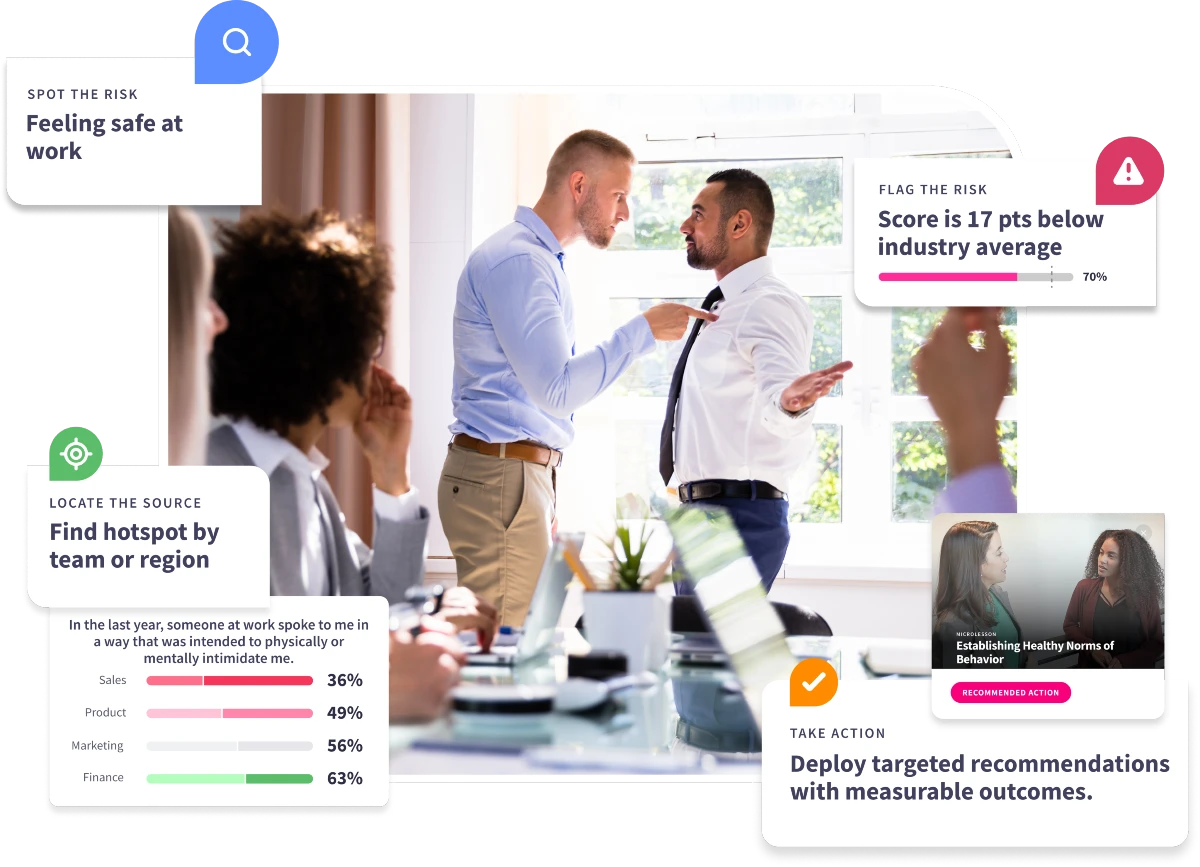
The only workplace safety training that not only identifies your risk for dangerous incidents — but shows you exactly where it exists, down to the question, benchmark, and department — and gives you the tools to fix it.
Emtrain aggregates question-level data from training to uncover warning indicators tied to safety and violence risk.
Flag the Risk
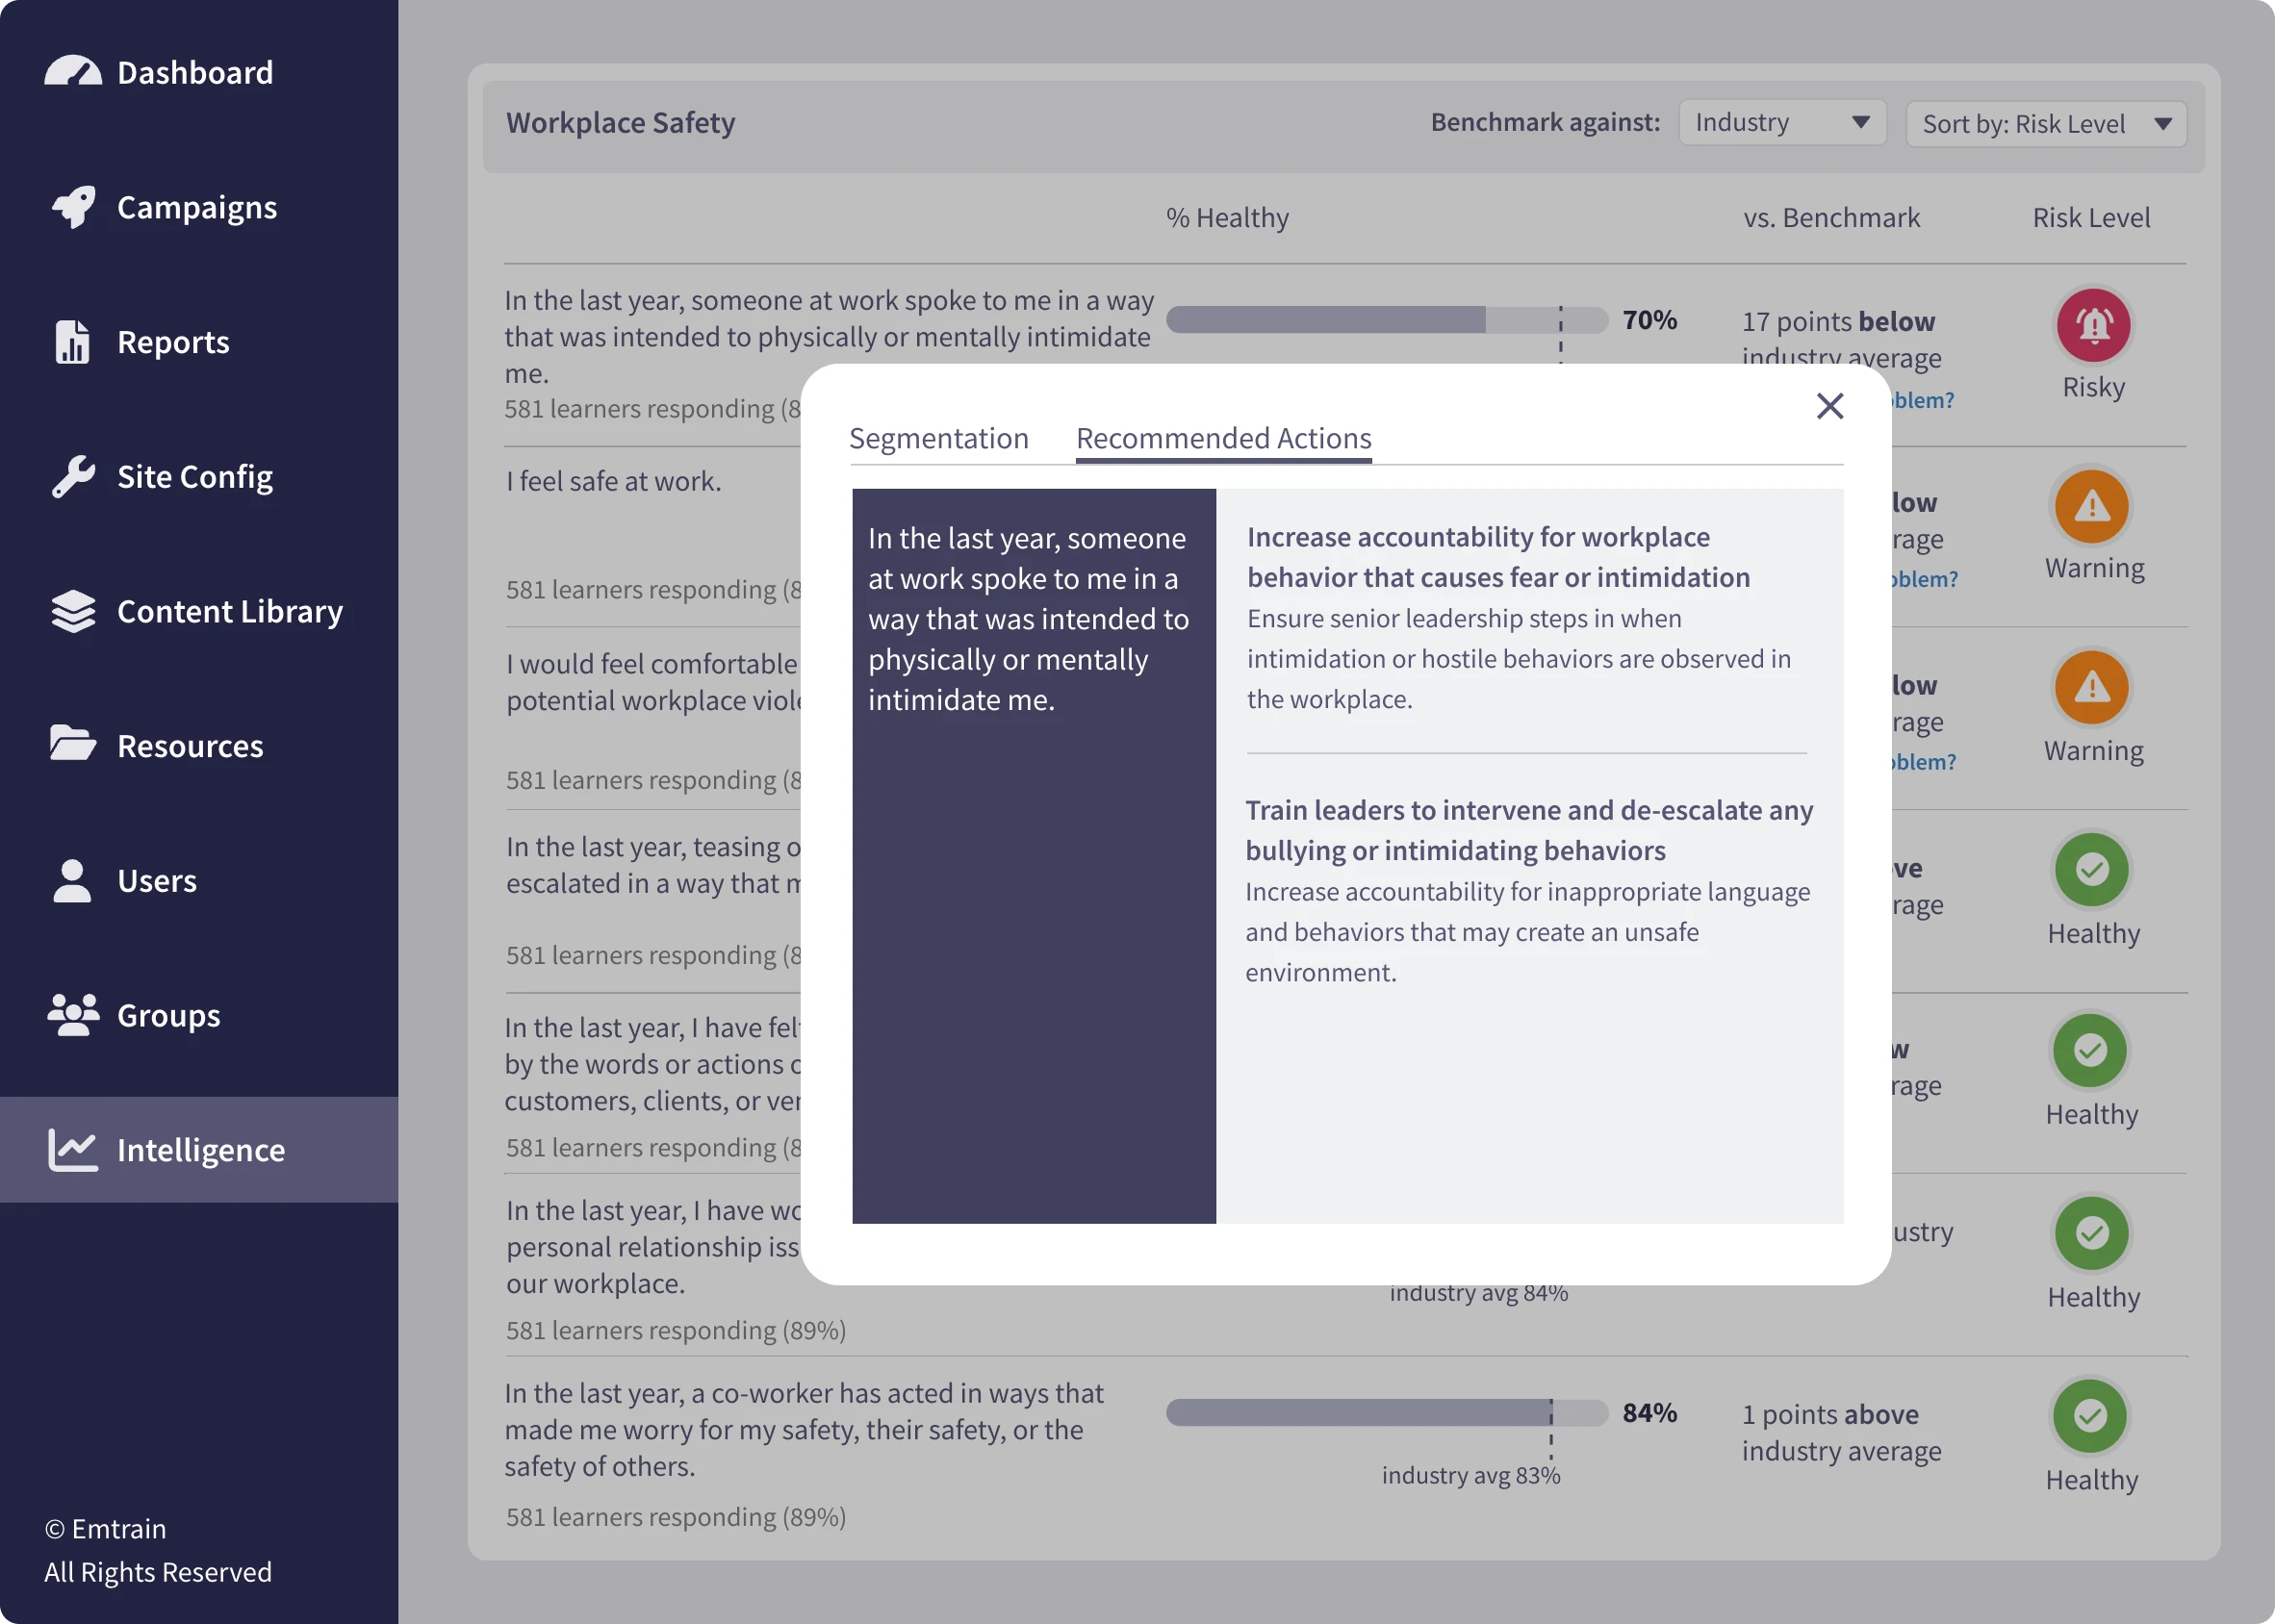
Dive deeper into specific question scores. See how your team compares to industry benchmarks, broken down by key risk indicators. Our proprietary algorithm reveals how healthy your culture is relative to industry norms — a first-of-its-kind benchmark engine for compliance and culture.
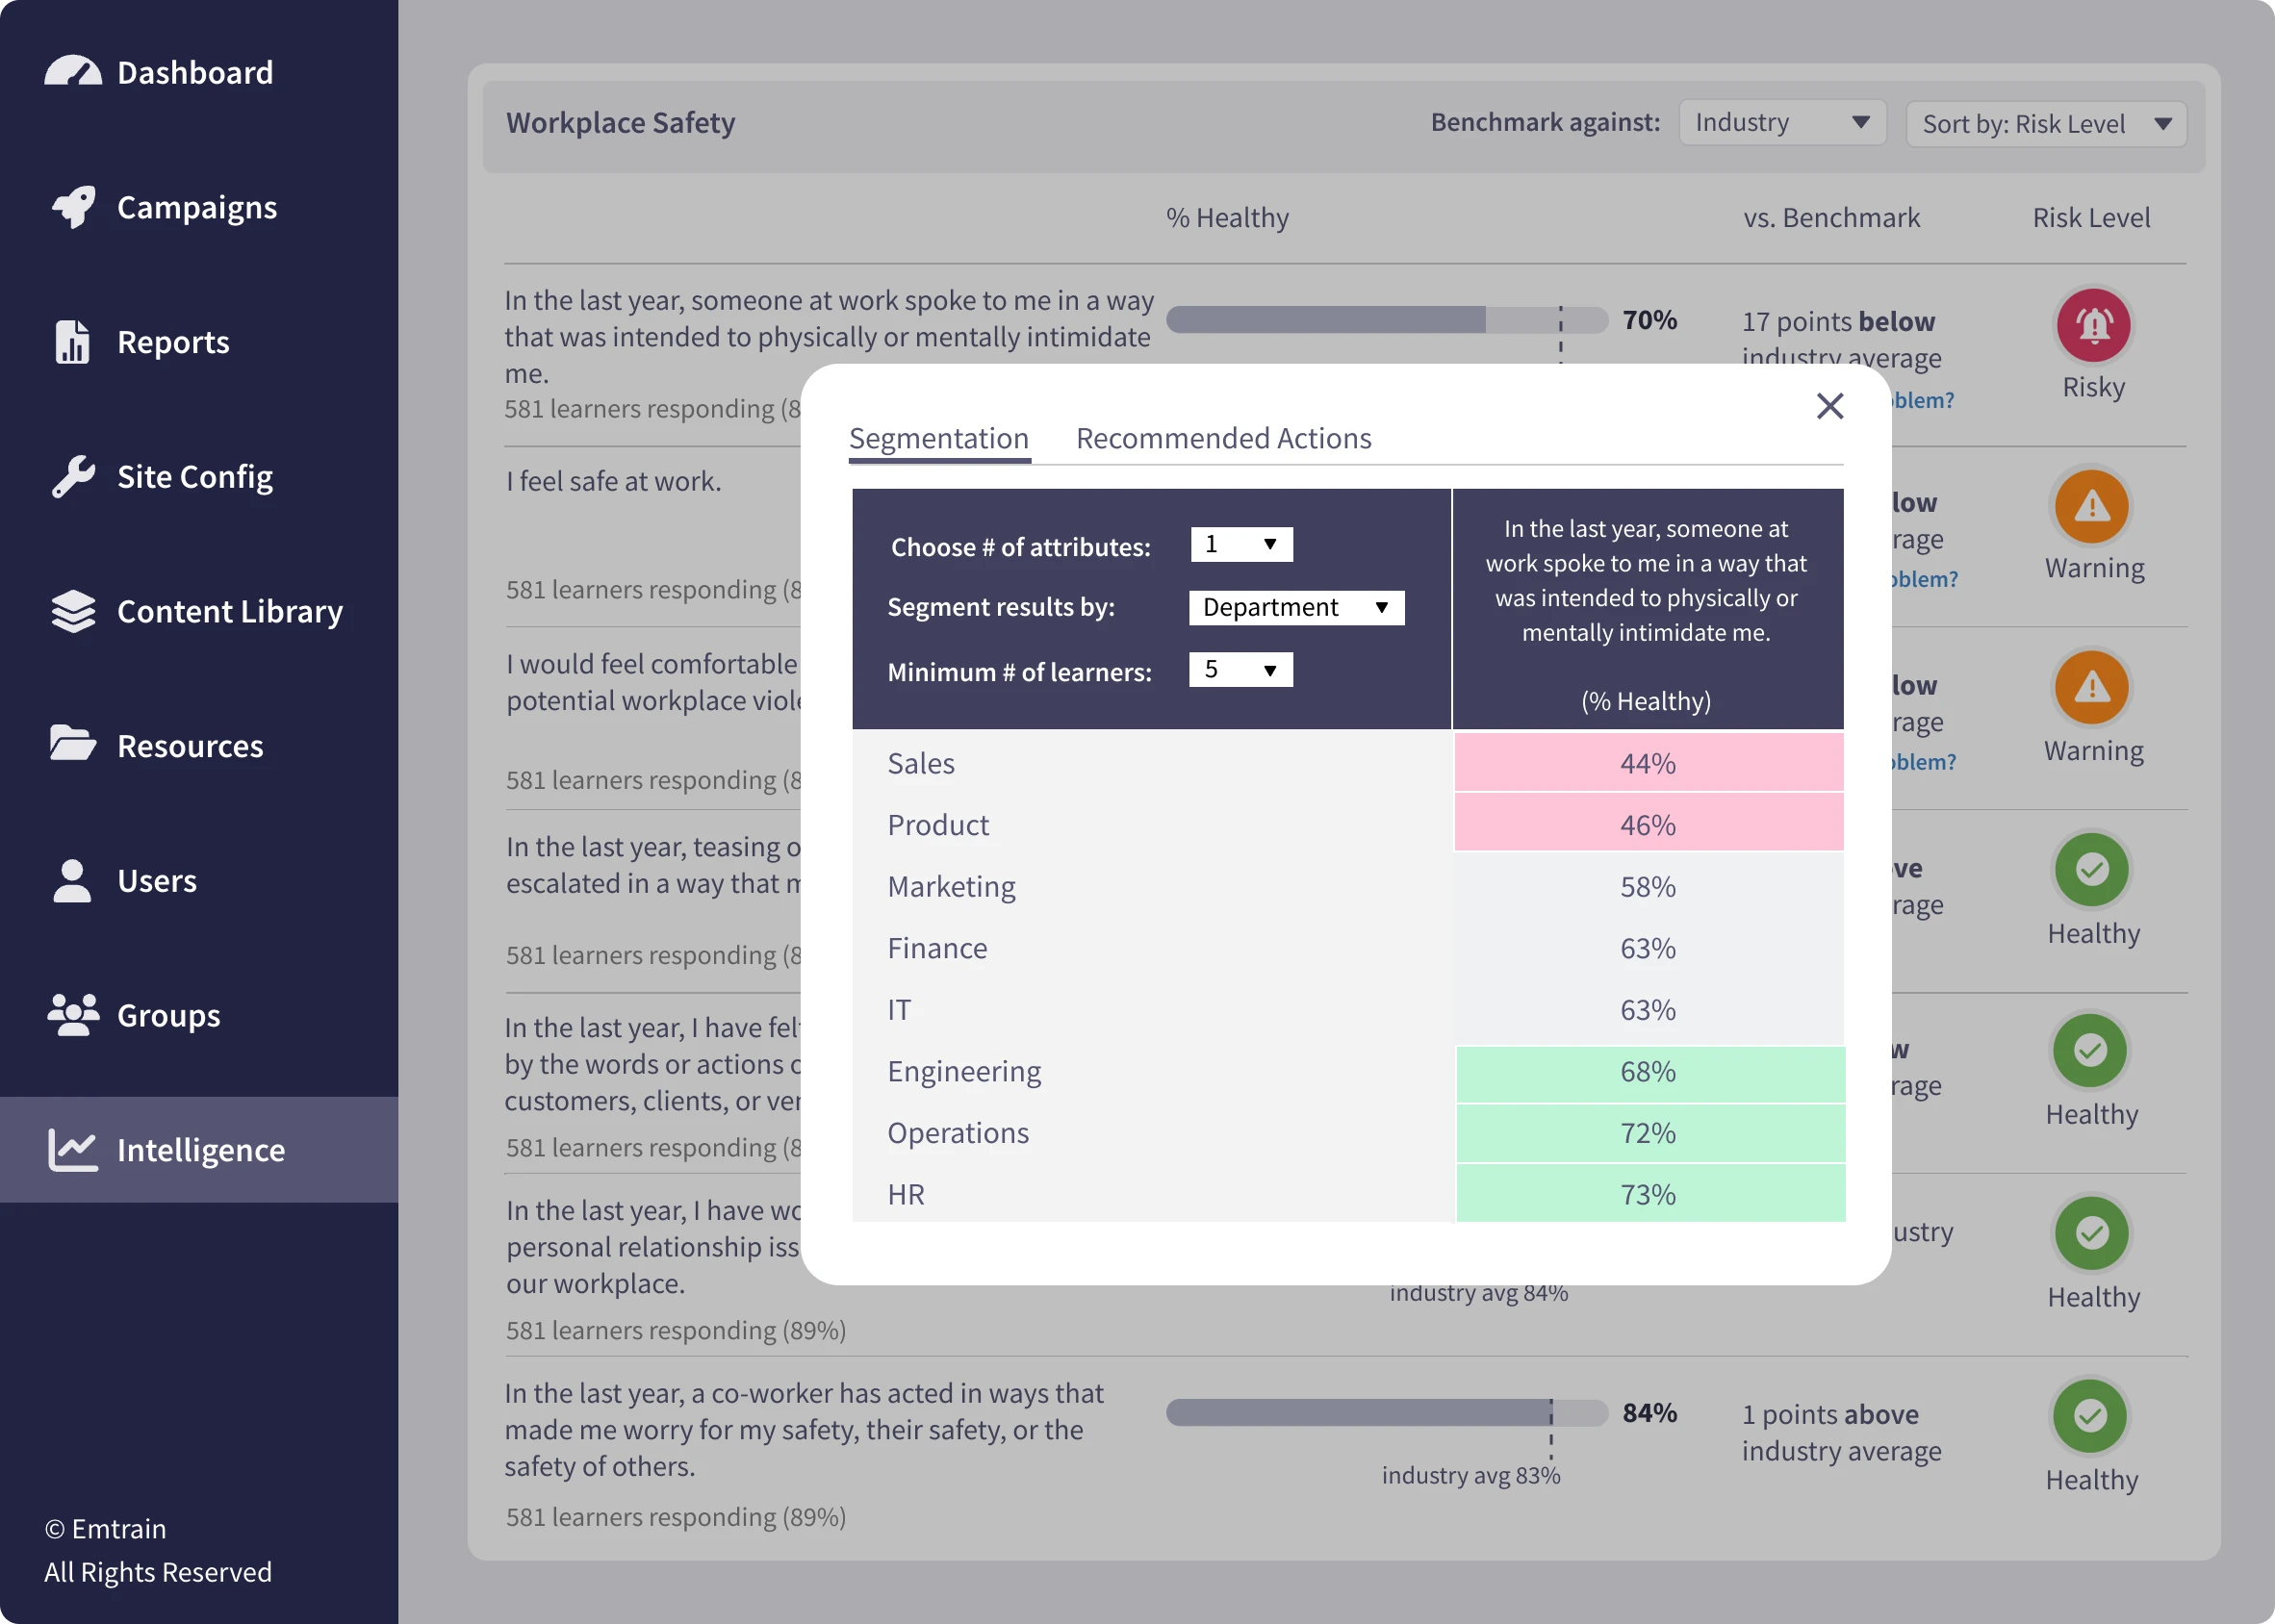
Locate the Source
Pinpoint which departments, teams, or roles are signaling risk — so you know exactly where to act.
Take Action
Get tailored guidance and recommendations based on the data, from course reassignments to policy improvements.
The following are sample employee relations risk assessment questions from Emtrain’s training courses. These questions help surface employee sentiment and behavior patterns at scale—enabling organizations to identify early warning signs, detect culture hot spots, and assess knowledge and skill gaps.
Risk Questions for Workplace Safety
With a focus on Workplace Safety in the workplace, these sample questions are drawn from our Workplace Violence Course.
“I feel safe at work.”
“In the last year, I have felt threatened or intimidated by the words or actions of non-employees — like customers, clients, or vendors.”
“In the last year, a co-worker has acted in ways that made me worry for my safety, their safety, or the safety of others.”
All of our content is authored and reviewed by employment lawyers and industry experts. Our content team is also led by our CEO Janine Yancey, a former employment litigator and workplace investigator who is a certified expert witness on harassment training in both state and federal courts. Janine Yancey was also the expert witness to the California State Senate, who helped author SB 1343 in 2018 – California’s harassment training mandate for all California employees
Old content gets stale. We've filmed all new videos around timely and poignant topics.
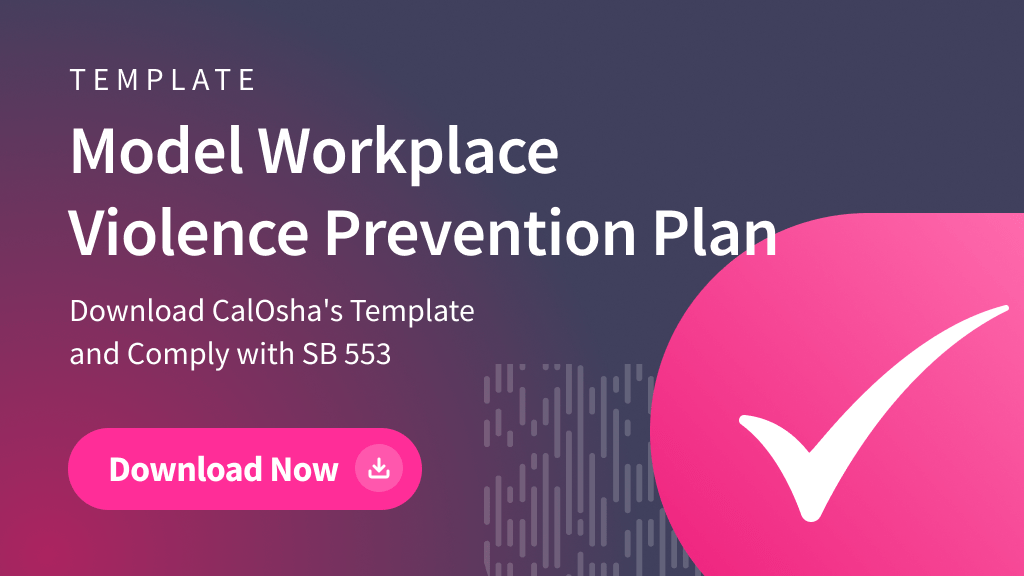
CalOsha’s Model Written Workplace Violence Prevention Plan Template
California Senate Bill 553 (CA SB 553) mandates that all employers covered under California Labor Code 6401.7 and 6401.9 establish, implement, and maintain a comprehensive Workplace Violence Prevention Plan (WVPP) by July 1, 2024. To assist businesses in meeting these requirements, Cal/OSHA has provided a Model Written Workplace Violence Prevention Plan for General Industry (Non-Healthcare Settings).
"This is my 2nd time selecting Emtrain as a preferred vendor for compliance training courses."
"The customer service teams are amazing. They are always a phone call away, are willing to go above and beyond to find the best solution for your business."
"I highly value Emtrain for their cutting-edge approach in delivering high-quality training through their Revolutionary Compliance and Anti-harassment programs. Their innovative approach is something that I truly appreciate."
Frequently Asked Questions
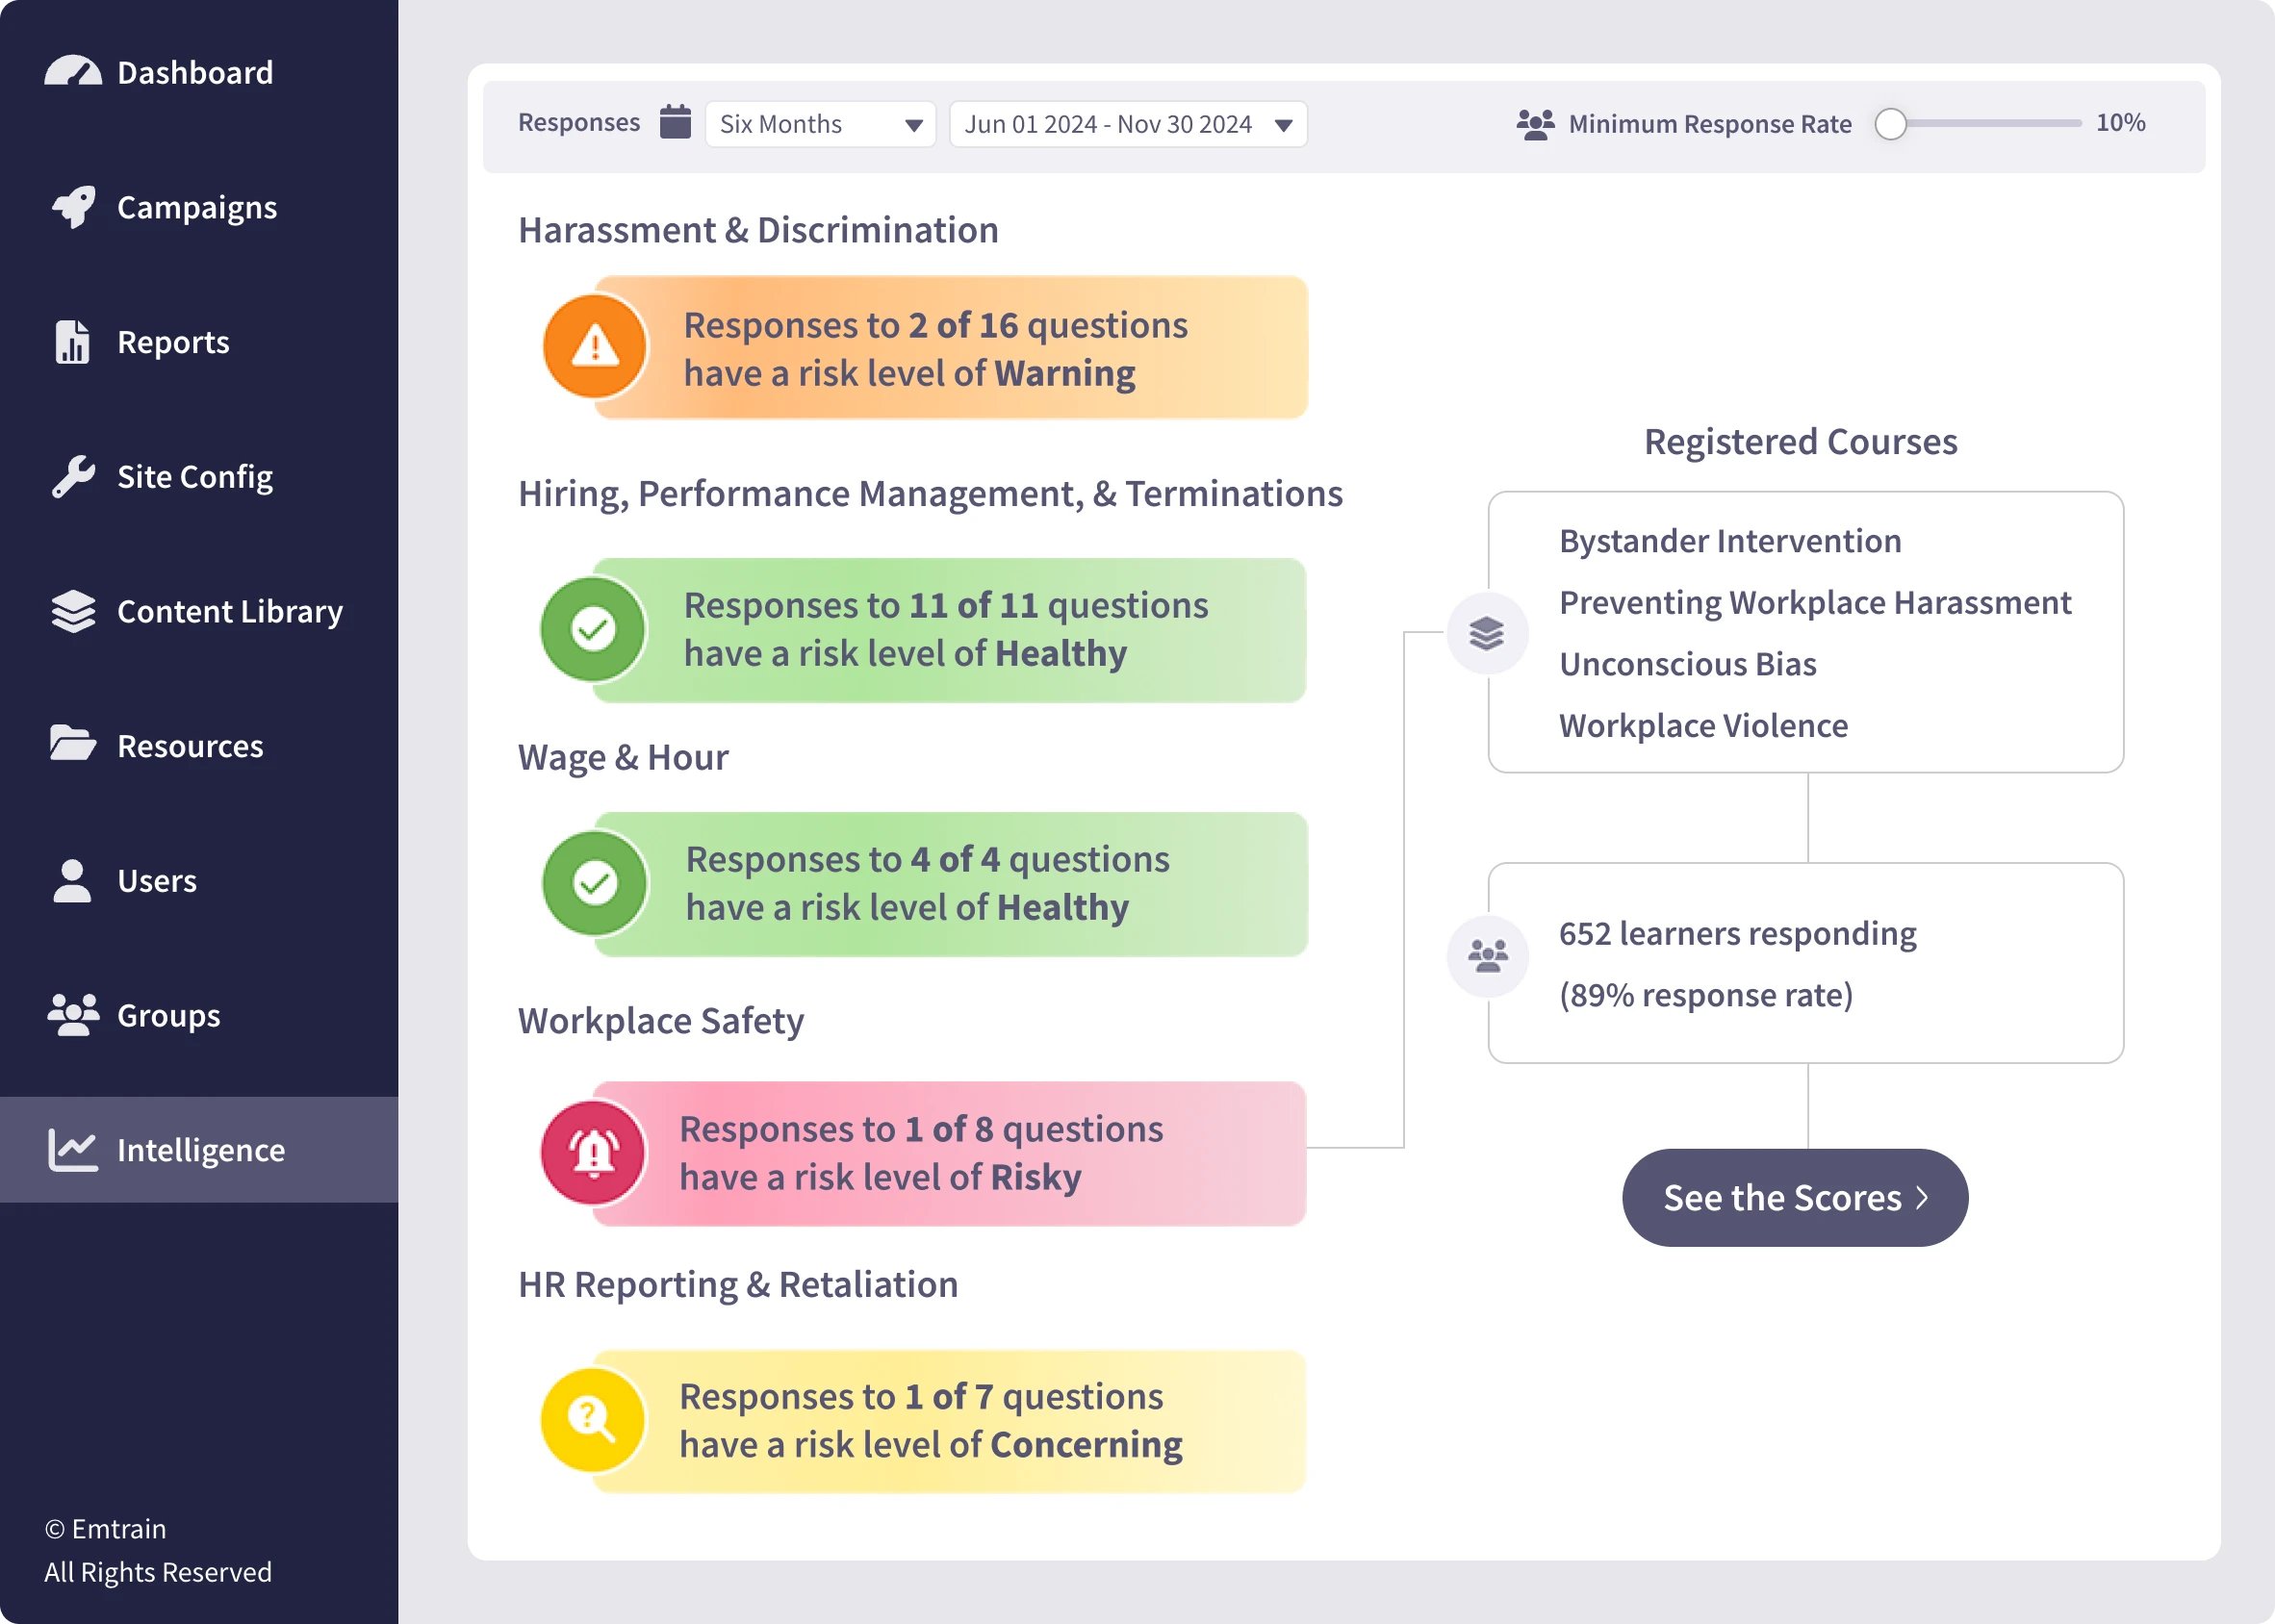
What does the HR & People Risk Summary page show me?
On this page, you’ll see a summary of results by risk category (e.g., Harassment & Discrimination, Workplace Safety). Each tile highlights:
The number of questions with Concerning, Warning, or Risky risk levels. If there’s no questions to flag, then it’ll say Healthy for all questions!
The total number of questions in that category
The related training topics that questions are drawn from
If you have not deployed the requisite training for a particular Risk Area, it will not populate.
This gives you a quick sense of which risk areas may require attention and where targeted training could make an impact.
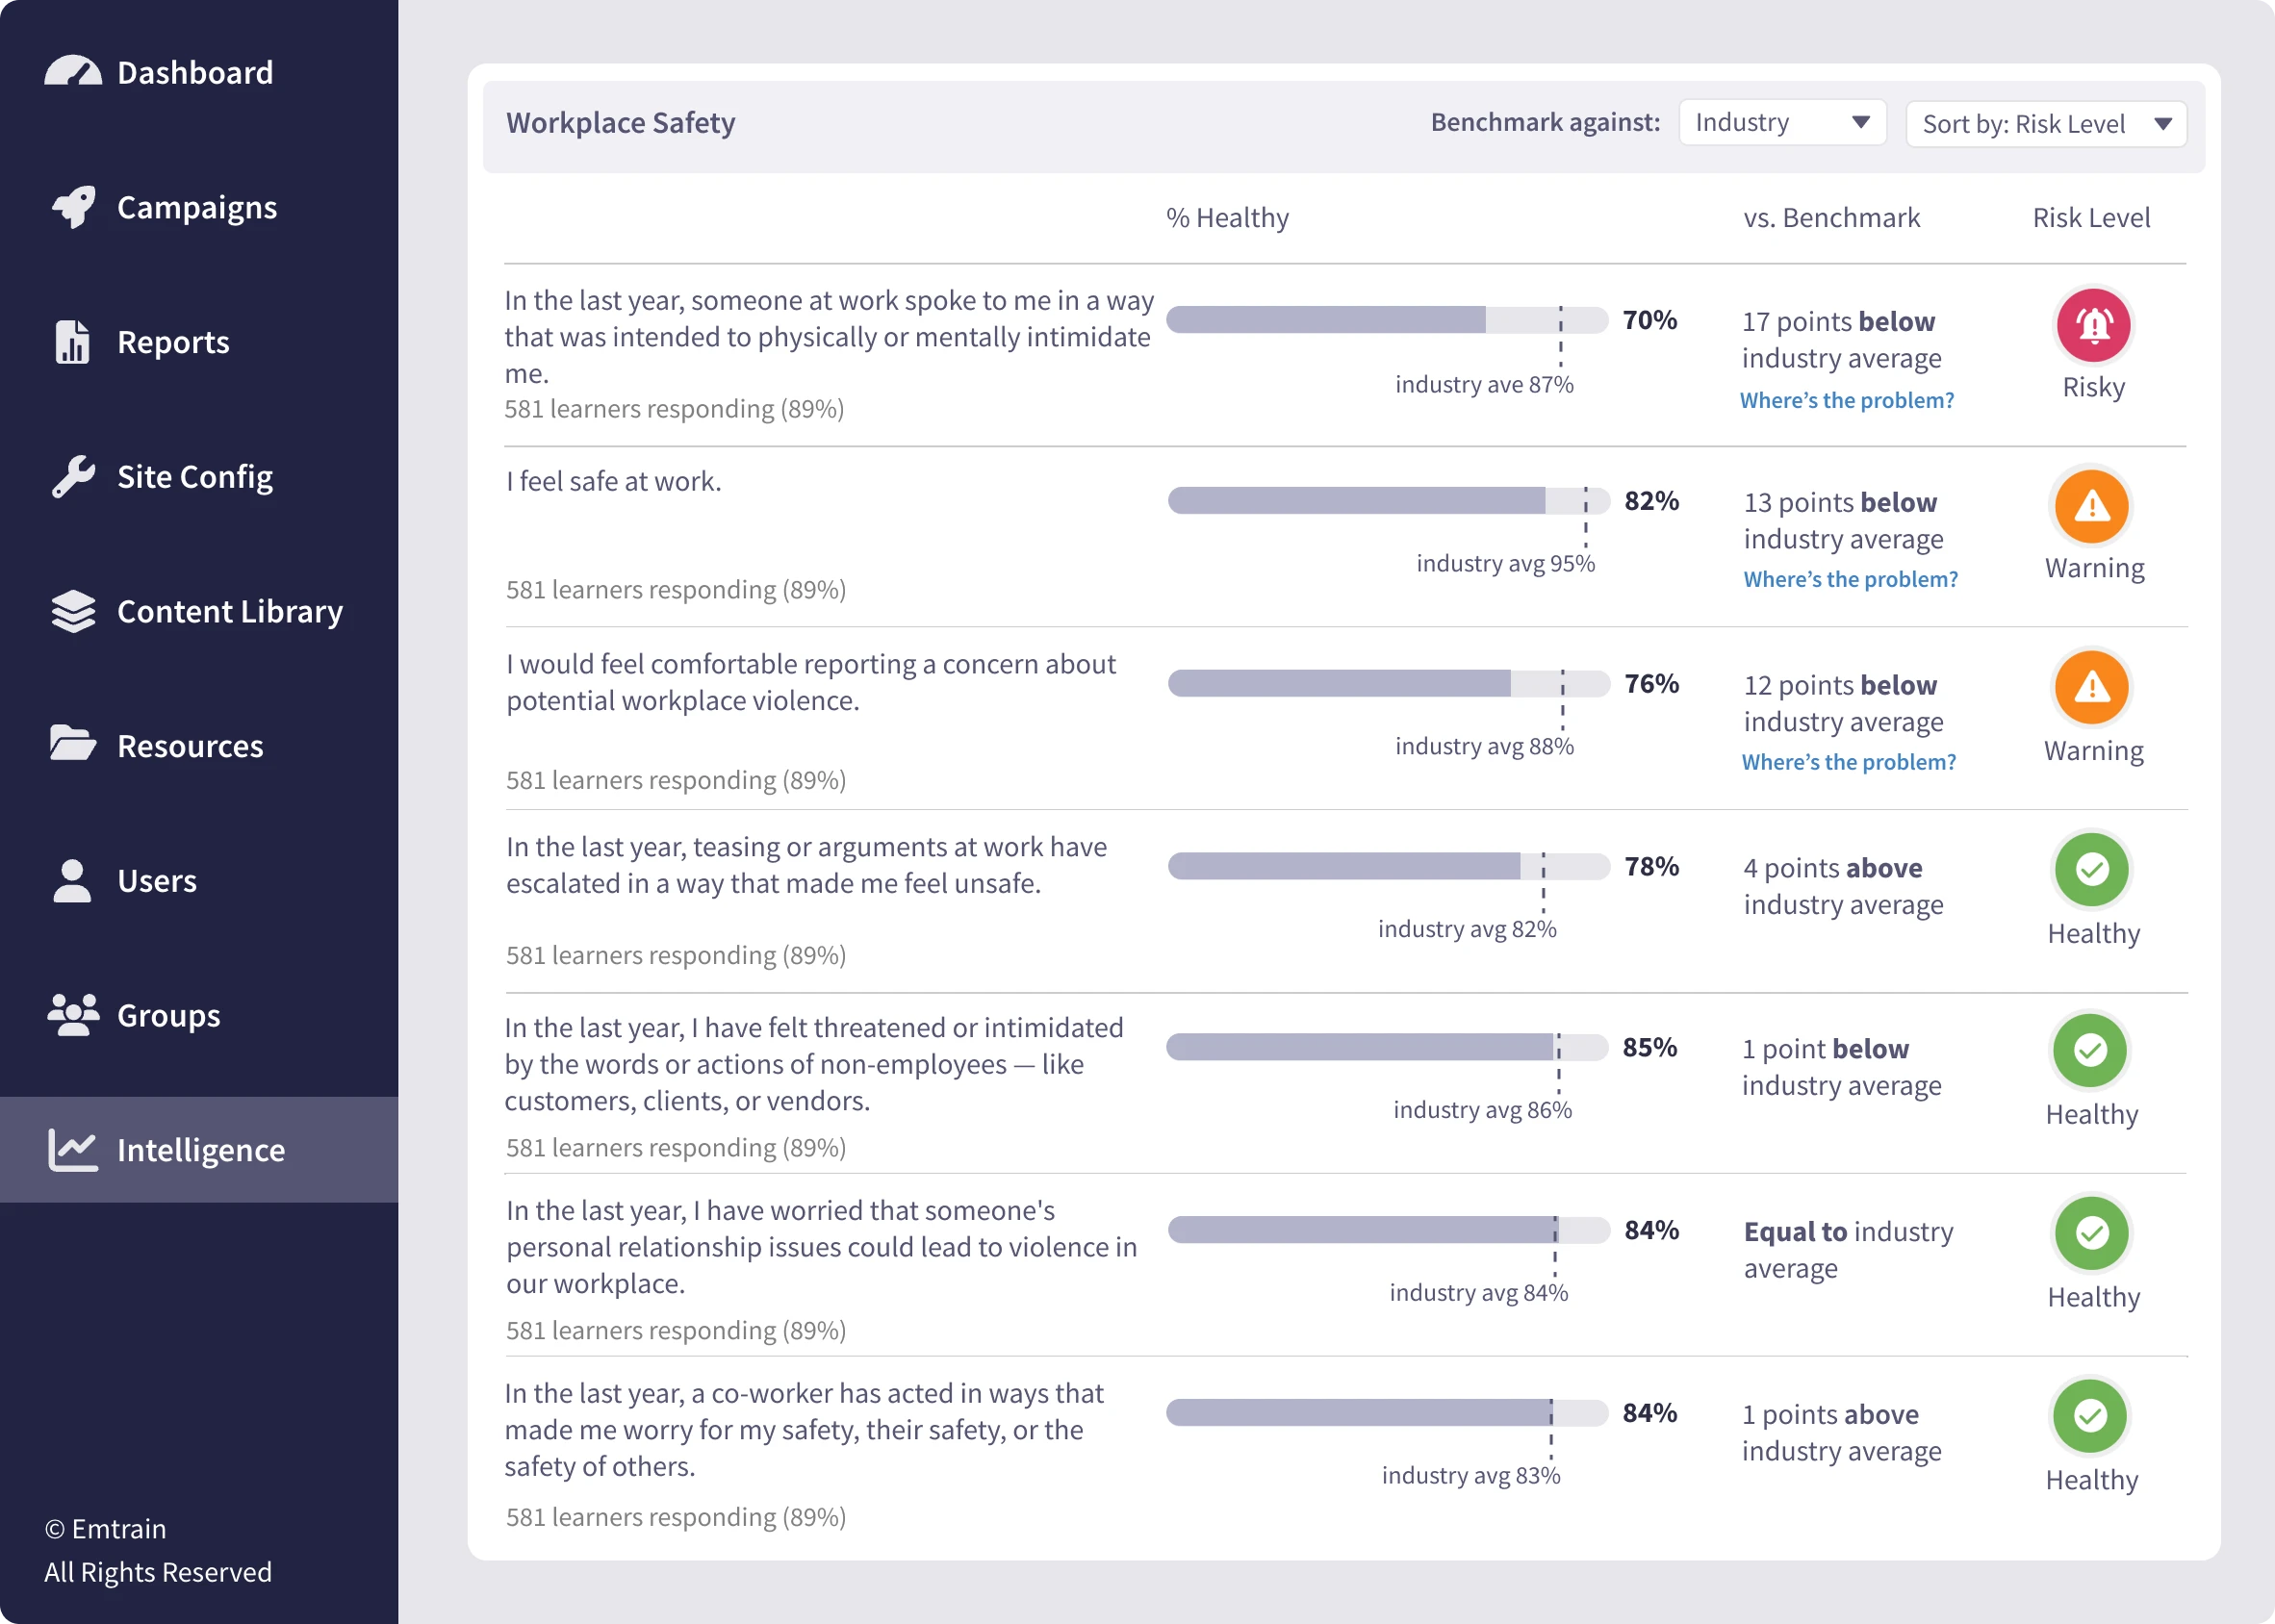
What does "Scores by Risk Area" show me?
Clicking into any risk category (e.g., Harassment & Discrimination) opens a detailed view of the individual Likert-scale questions that power the category’s score. Note: only clients whose package includes this screen will be able to access it!
For each question, you’ll see:
The full question text
Percentage of healthy responses
Comparison to the industry average
A calculated risk level (Healthy, Warning, Concerning, or Risky)
This level of granularity lets you pinpoint exactly what employees are experiencing—and whether it’s a perception issue or something more systemic.
Coming soon: Comparisons to longitudinal scores (i.e. scores last year) and organizations of similar size.
What does "% Healthy" mean?
“% Healthy” refers to the percentage of respondents who selected one of the three positive responses (e.g., Slightly Agree, Agree, or Strongly Agree).
For negatively worded questions (e.g., “I’ve heard people make negative stereotypical comments”), healthy responses come from employees who disagree (e.g., Slightly Disagree, Disagree, or Strongly Disagree) with the statement. In these cases, a high “% Healthy” still reflects a positive outcome—indicating that few people are observing or experiencing the negative behavior described.
A high healthy score means most employees feel positively about the topic, indicating a strong and constructive workplace culture. Lower scores may point to dissatisfaction, mistrust, or emerging risk areas that warrant closer review.
Why compare to industry benchmarks?
Each question is benchmarked against aggregated industry data from similar organizations. Internal scores show you where your teams stand—but benchmarks reveal how your culture stacks up externally. A score might look “fine” in isolation but could be trailing significantly behind peers.
How do you define your industries?
We use the codes defined by the North American Industry Classification System (NAICS) . For tax and documentation purposes, every organization based in the United States is required to register under one of the following industries within the NAICS, which makes it straightforward to use these reported classifications for our benchmarking:
Accommodation and Food Services
Administrative and Support and Waste Management and Remediation Services
Arts, Entertainment, and Recreation
Construction
Educational Services
Finance and Insurance
Health Care and Social Assistance
Information
Manufacturing
Nonprofit or Non-Governmental Organization (NGO)
Professional, Scientific, and Technical Services
Public Administration
Real Estate and Rental and Leasing
Retail Trade
Transportation and Warehousing
Utilities
Important note: In cases where we believed an organization’s reported NAICS code significantly diverged from its actual operations or mission, we manually reclassified it to the most appropriate category based on its core activities.
Are all industries equally represented?
No. Some industries have significantly more client representation than others. This disparity stems from various factors, including how well Emtrain’s content resonates with certain industries and the geographic concentration of those industries.
When we have a sufficient number of clients in a given industry (at least 15), we benchmark your results against the industry average. If we don’t have enough data, we instead compare your results to the global average of all clients.
Can I change my reported industry?
Yes! If you do not feel your organization is tagged with the appropriate industry, just let us know at analytics@emtrain.com and we’ll get that updated.
What does the “Risk Level” icon mean?
The icon next to each question summarizes whether it presents a cultural or compliance risk:
Healthy: Scores are within a safe and productive range
Warning: Needs attention—trending low or nearing a risk threshold
Concerning: Warrants further investigation
Risky: High risk—immediate action is likely needed
These flags help you prioritize where to intervene first, especially when managing multiple risk areas.
What filters do I have available?
Use the filters in the left-hand sidebar to refine your results:
Risk Area: Focus on a specific domain like Workplace Safety or Wage & Hour
Response Type: Choose which training areas to include
Date Range: Select the timeframe for data (e.g., past 6 months)
Minimum Response Rate: Filter out low-participation segments
New Hires*: Choose whether to include newer employees
Who is considered a new hire?*
New hires are defined as respondents with less than 1 year of tenure at your organization. Since most training is delivered on an annual cycle, these employees will be flagged as “new hires” when they receive their first training shortly after joining. By the time they complete their second training cycle a year later, their responses will no longer fall into this bucket.
Explore More Risk Areas
Discover more areas where Emtrain Intelligence helps mitigate people and compliance risk.